

Product
Solutions
Our Approach
Resources
Company

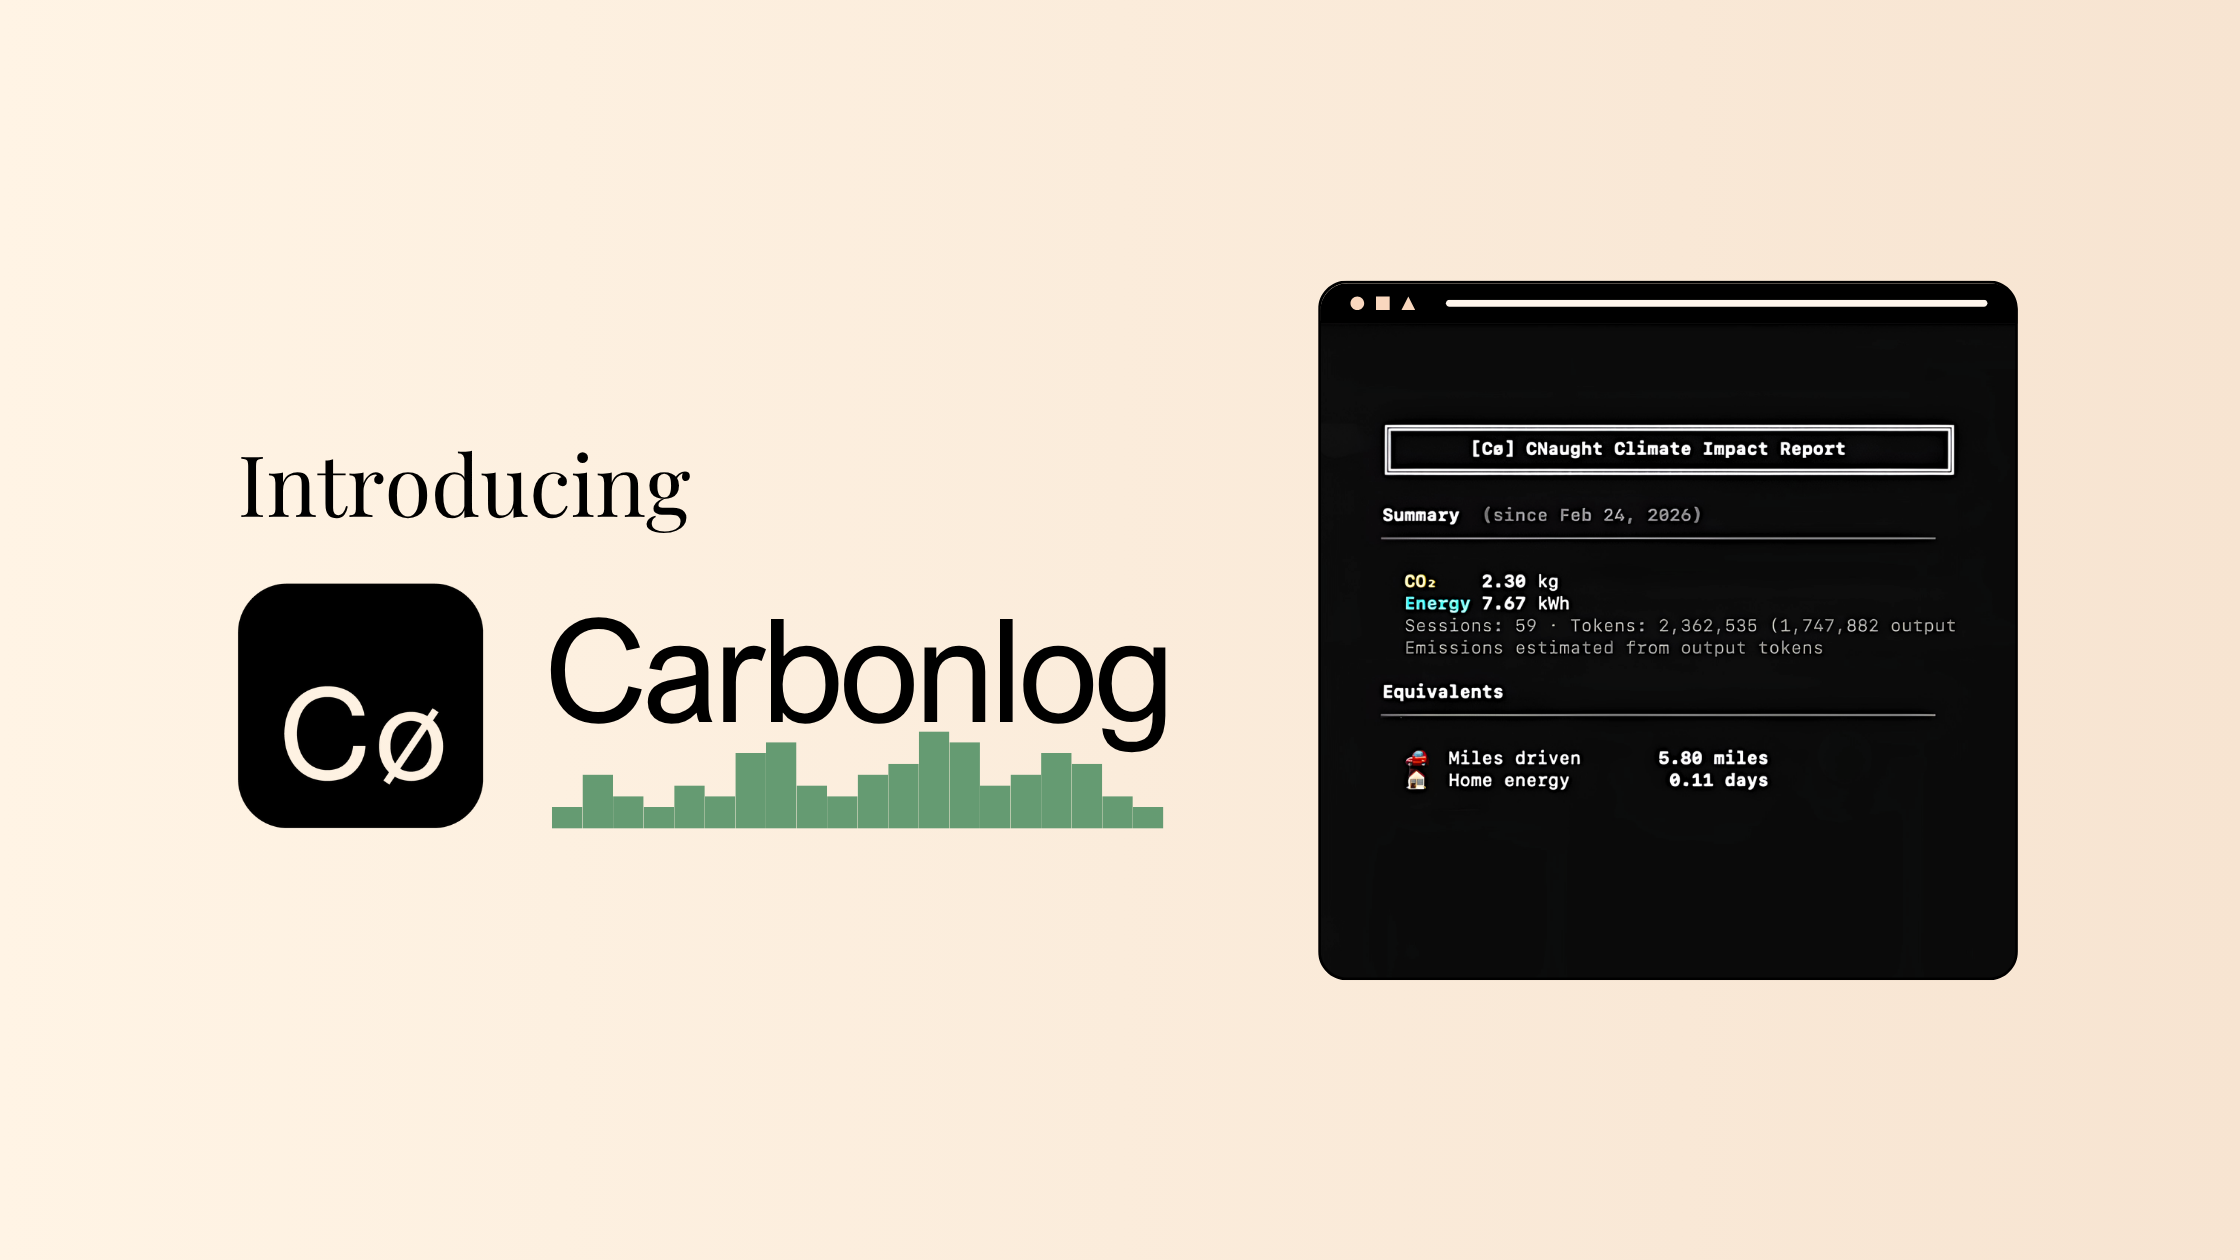
Carbonlog makes the invisible visible. Install one plugin, and see the environmental cost of every AI coding session as you work.
AI coding tools have reshaped how software gets built, yet the environmental cost of all that activity is largely invisible.
If you've read our previous piece on AI's carbon footprint, you know why: the companies building these systems disclose almost nothing about their environmental impact, and measuring any of this with confidence is difficult.
Estimation tools do exist, but they often require time-consuming setups and rely on opaque assumptions. For sustainability professionals and engineering leaders trying to keep up with their team's footprint, the barrier to entry is too high and the confidence in the outputs too low.
We built Carbonlog to fix this. It's a Claude Code plugin that tracks the carbon emissions of your AI coding sessions in real time, using an independent methodology from leading researchers. This post explains why existing tools fall short, how Carbonlog works, and how to use its outputs in sustainability reporting.
A widely used open-source tool for estimating LLM inference emissions is EcoLogits, a Python library published in the Journal of Open Source Software in 2025. EcoLogits intercepts API responses, extracts token counts and latency, and computes energy using a regression curve fitted to benchmark data.
As any model, Ecologits relies on a number of assumptions. So does Carbonlog. The core challenge is that AI providers disclose almost nothing about their infrastructure, which means every estimation tool must fill those gaps with informed assumptions. The tools differ in which assumptions they make and how sensitive the results are to those choices. Here's where the approaches diverge:
Batch size. When a server processes multiple requests simultaneously, it can spread its fixed energy costs across all of them. EcoLogits assumes 64 concurrent requests per server, which amortizes fixed overhead across many users. Empirical benchmarks from Jegham et al.'s 2025 paper "How Hungry is AI?" suggest real-world batch sizes are closer to 4-16, and sensitivity analysis in that paper shows that moving from batch size of 8 to 64 reduces estimated energy by roughly 80%.
Carbonlog inherits this same sensitivity: batch size is not directly observable, and the assumption used meaningfully affects results. This is one of the largest sources of uncertainty in any inference emissions estimate, including ours.
Hardware. EcoLogits cannot distinguish between a model running on a cutting-edge NVIDIA H200 Graphics Processing Unit (GPU) versus older A100s. It assumes a generic 80GB GPU for all models and derives GPU count from parameter count. Research from Jegham et al. found that OpenAI’s GPT-4o mini running on A100 hardware actually consumes more energy than the larger GPT-4o running on H200s. This counterintuitive result only emerges from infrastructure-aware modeling.
The cumulative effect of these assumptions is substantial. In head-to-head comparisons using the same query configuration (1,000 input tokens, 1,000 output tokens), we found gaps ranging from rough parity to nearly 19x:
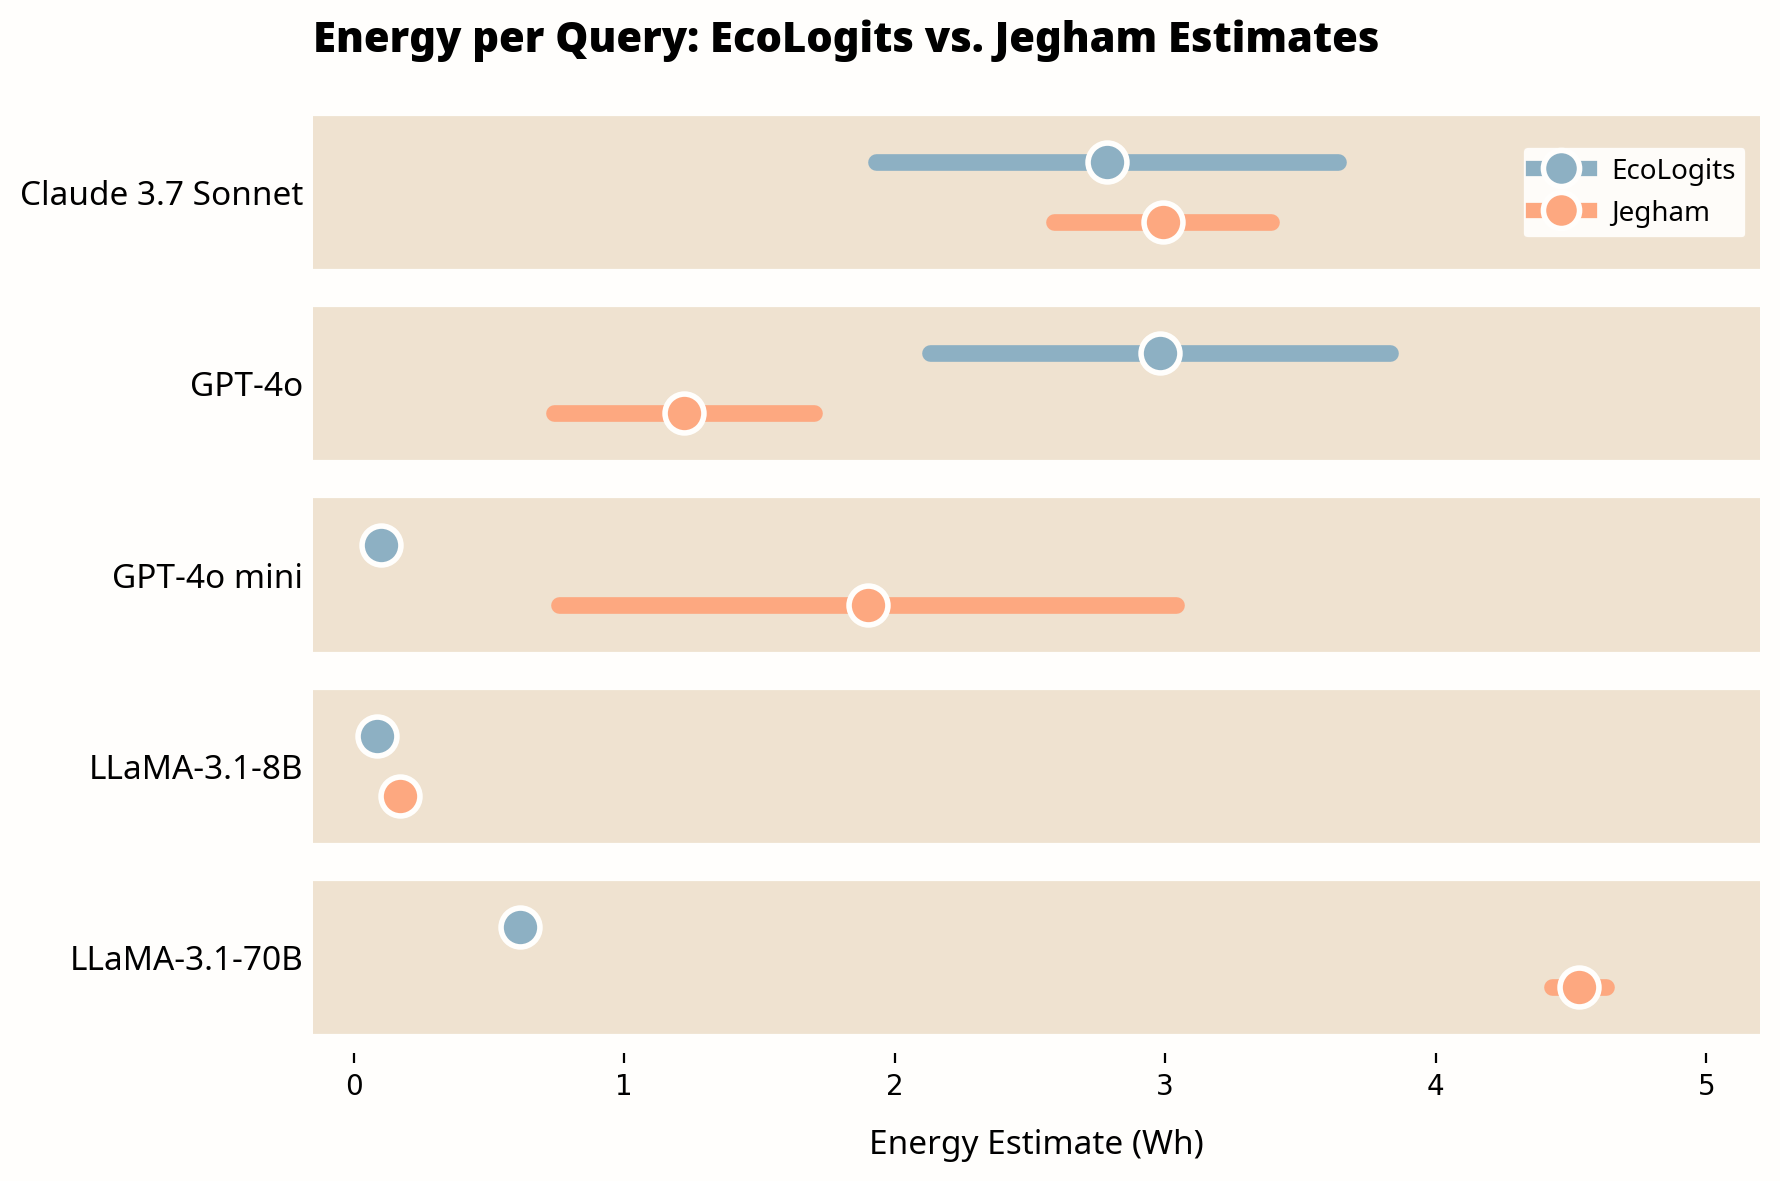
Estimates for the same query (1,000 input tokens, 1,000 output tokens) vary significantly across methodologies. Bars show 95% confidence intervals; dots show midpoint estimates.
Source: CNaught internal analysis comparing EcoLogits v0.x against Jegham et al. (2025). Jegham figures from Table 4 of the paper (medium prompt configuration).
Note: This comparison uses models available in the Jegham et al. dataset at time of publication. We prioritize independent academic methodology over provider-disclosed figures, which carry inherent conflicts of interest. As newer models are benchmarked, we will update these comparisons. Plugin updates are distributed through the CNaught marketplace.
For current Claude models not yet in the dataset, Carbonlog uses averaged benchmark values from the same model family. Our commitment is to use the best available science and keep evolving as the research evolves, so you don't have to.
There are multiple methodologies for estimating AI inference emissions, and as the chart above illustrates, they can produce very different results for the same query. None of them can claim to produce ground truth. Given that variability, we chose the Jegham et al. framework for two reasons.
First, it estimates energy from first principles rather than fitting curves to benchmark data. Jegham et al. collect real-time latency and tokens-per-second data from Artificial Analysis, a public benchmarking source. They use statistical tests to infer which GPU hardware each model runs on. They apply provider-specific carbon intensity factors tied to actual datacenter regions rather than country averages. And they run 10,000 Monte Carlo draws per model to produce estimates with explicit uncertainty bounds.
Second, it errs on the side of caution. Where other approaches make more conservative assumptions that tend to produce lower estimates, the Jegham framework is less conservative. For organizations trying to understand and manage their AI footprint, we believe an approach that risks overestimating is a safer bet than one that risks underestimating. You can always revise down; building a sustainability plan around numbers that are too low is a harder problem to fix.
More validation work is needed, and we expect the field to evolve. We implemented a simplified version of this framework in Carbonlog.
Carbonlog is a Claude Code plugin that estimates the energy consumption and CO₂ emissions of your coding sessions in real time.
For each API request to Claude, Carbonlog estimates energy as:
Inference time × system power draw × datacenter PUE
Inference time is estimated as the model's median time to first token (TTFT) plus output token count divided by the model's median generation speed (tokens per second). Both TTFT and TPS values are sourced from Artificial Analysis performance benchmarks. System power draw is computed at Jegham's minimum and maximum GPU utilization bounds and averaged, incorporating both GPU and non-GPU subsystem power. All Anthropic models are assigned AWS infrastructure parameters: a Power Usage Effectiveness (PUE) of 1.14 and a carbon intensity factor of 0.287 kgCO₂e/kWh.
CO₂ emissions are then calculated as:
Energy (Wh) × Carbon Intensity Factor (kgCO₂e/kWh)
For multi-request sessions, each API call is calculated independently so that every request incurs its own TTFT cost. Results are aggregated across the session and rounded to whole numbers to reflect the inherent uncertainty in the underlying estimates.
Once installed, Carbonlog adds a status line to Claude Code showing real-time emissions:
Climate Impact: CO₂ 0.287kg · Energy 9kWh ⇄
Run /carbonlog:report to generate a summary that includes:
The plugin stores data locally in a SQLite database. Nothing is shared unless you explicitly enable anonymous metric sync during setup.
Our implementation is a simplification of Jegham et al.'s full framework.
A few things to be aware of:
Input tokens are partially accounted for. TTFT captures some input processing time because it reflects real prefill latency. However, we use a fixed median TTFT per model rather than one that scales with actual input length. Sessions with very large context windows (over 10,000 input tokens) may be underestimated.
Newer model values are approximated. For Claude models not covered in the original Jegham et al. dataset, we use average benchmark values from models in the same family (Sonnet, Opus, Haiku). As the dataset is updated, we will incorporate more precise values.
Point estimates rather than ranges. Jegham et al.'s Monte Carlo sampling exists because key inputs (batch size, GPU utilization) are not directly observable. We report point estimates for simplicity, which implies more precision than the methodology can support. Treat results as order-of-magnitude estimates, not exact measurements.
We designed Carbonlog to be transparent about these constraints. Results should be interpreted accordingly.
If you're responsible for your organization's GHG inventory, here's how Carbonlog outputs fit into standard reporting frameworks.
Carbonlog estimates operational energy emissions from Claude inference on Anthropic's datacenter infrastructure. This corresponds to Scope 2 emissions on Anthropic's side. In your organization's GHG inventory, this typically appears as Scope 3, Category 1: Purchased Goods and Services (if you treat AI inference as a purchased service).
The current version of Carbonlog is designed for individual developer use. For organizations interested in team-wide deployment and aggregated reporting, contact us at cnaught.com/contact-sales.
Training emissions. The energy used to train Claude models is not included. Training is a one-time cost amortized across many users and is generally considered Anthropic's responsibility to report. If you wish to include an allocated share of training emissions, consult Anthropic's published sustainability disclosures where available.
Embodied emissions. Hardware manufacturing emissions (the carbon cost of producing GPUs and servers) are excluded, consistent with the Jegham methodology. These are difficult to attribute on a per-query basis across shared infrastructure.
Your local infrastructure. Emissions from developer machines, code editors (IDEs), and network activity are not included.
Anthropic's broader value chain. Scope 3 emissions from Anthropic's own supply chain, facilities, and employee activities are outside the scope of this tool.
When reporting Carbonlog outputs in sustainability disclosures, we recommend including the following context:
For most organizations, AI inference emissions represent a small fraction of total Scope 3 today. But the trajectory is steep. The IEA projects data center electricity consumption will more than double by 2030. Meanwhile, Goldman Sachs Research estimates that if 60% of new data center power demand is met by natural gas, the resulting emissions increase could reach 215-220 million tonnes of CO₂ by 2030, roughly equal to every carbon credit retired in the voluntary market last year.
California's SB 253, for example, will require companies with over $1 billion in revenue to report Scope 3 emissions starting in 2027. Organizations that have baseline data when these requirements take effect will be better positioned than those starting from scratch.
See it in action: Jacob, our head of product, walks through installation and your first Climate Impact Report in under five minutes.
Prefer to follow along in text? Here's the step-by-step:
Carbonlog requires Node.js (v18+) with npx available on your PATH. All other dependencies are installed automatically.
To install:
/plugin marketplace add CNaught-Inc/claude-code-plugins
/plugin install carbon@cnaught-plugins
Restart Claude Code and run /carbon:setup to initialize the tracker. Setup walks you through:
Once configured, tracking happens automatically. The plugin uses Claude Code hooks to parse session transcripts, calculate energy and CO₂, and save results to the local database.
Ten of thirteen major AI companies disclose nothing about their environmental impact. Until that changes, the burden of measurement falls on the companies using these tools.
Estimation methods exist, but they produce widely varying results and none of them have been easy to use. Carbonlog is built on independent academic methodology, designed to be turnkey, and committed to evolving with the best available science.
Sustainability teams get Scope 3 data they can include in GHG inventories. Engineering leaders get visibility into a category of emissions that's been invisible until now. And both get ahead of disclosure requirements before they become mandatory.
Measurement is the starting point. We're exploring how Carbonlog can move from visibility to guidance: surfacing lower-emission model choices, identifying unnecessarily token-intensive patterns, and helping teams reduce inference waste. For now, start with what you can measure.
Install it. Run /carbonlog:report. See what your AI usage actually costs.
Carbonlog produces order-of-magnitude estimates, not precise measurements. These figures are suitable for internal tracking, trend analysis, and order-of-magnitude reporting, but should not be presented as precise measurements in external disclosures without appropriate caveats about methodology.
Currently, Carbonlog is designed specifically for Claude Code. We are exploring extensions to support other AI coding tools and chat-based LLM usage in future versions.
All data is stored locally in a SQLite database on your machine. If you enable anonymous metric sync during setup, the following is shared: token counts, energy consumption, CO₂ emissions, models used, and a hashed project identifier. No code, conversation content, or personal information is ever shared.
Training emissions are a one-time cost amortized across millions of users. Attributing a share of training to individual users requires assumptions about total usage that would introduce more uncertainty than they resolve. We follow the Jegham et al. methodology in excluding training to avoid overstating confidence in the estimates. If you need to include training emissions for your reporting, we recommend consulting provider disclosures where available.
We recommend enabling auto-update for the CNaught marketplace so you always have access to the latest versions. Benchmark values from Artificial Analysis are periodically refreshed as model performance changes.
Carbonlog is open-source. For organizations looking to offset the emissions you track, CNaught provides science-backed carbon credit portfolios with rigorous due diligence and ongoing reporting support.


